Summary
Inaccurate design of dewatering systems results in on-site waste, in terms of space, energy, operations, and cost. This article presents a modern approach developed by VEI Contracting that leverages a High-Resolution Site Characterization (HRSC) tool to more accurately and abundantly collect relevant site data for designing and installing effective dewatering systems.

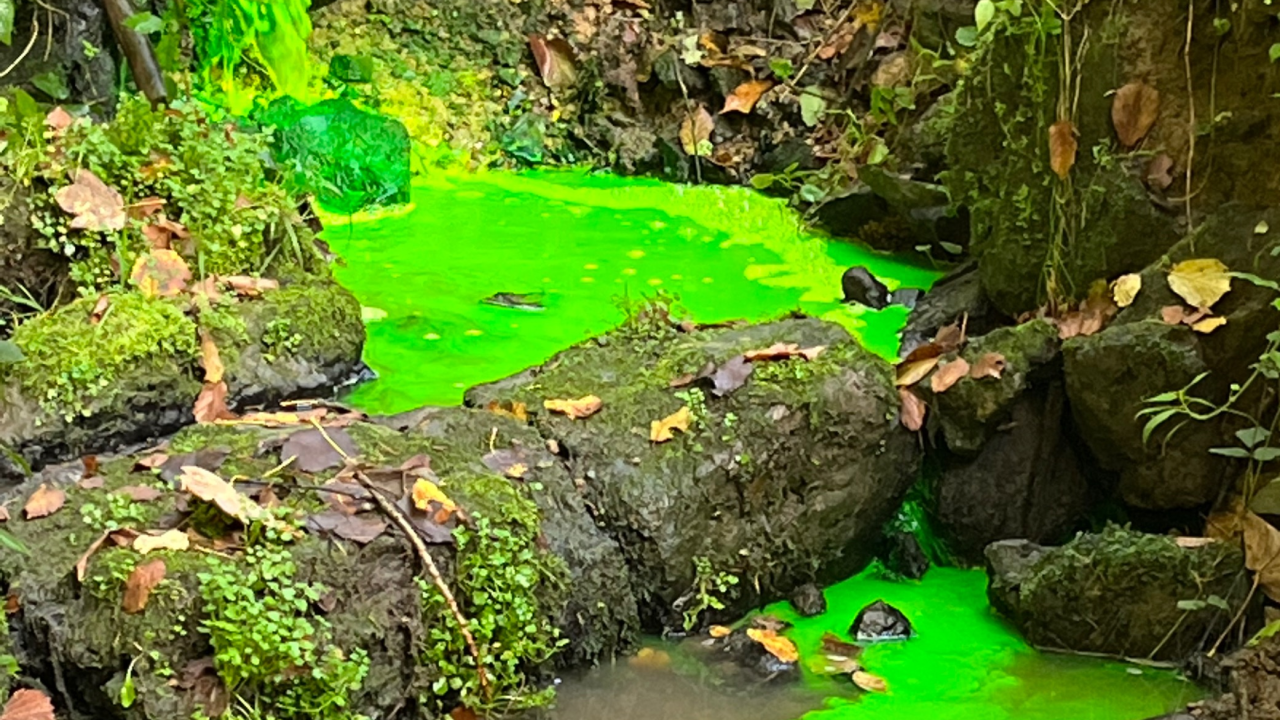
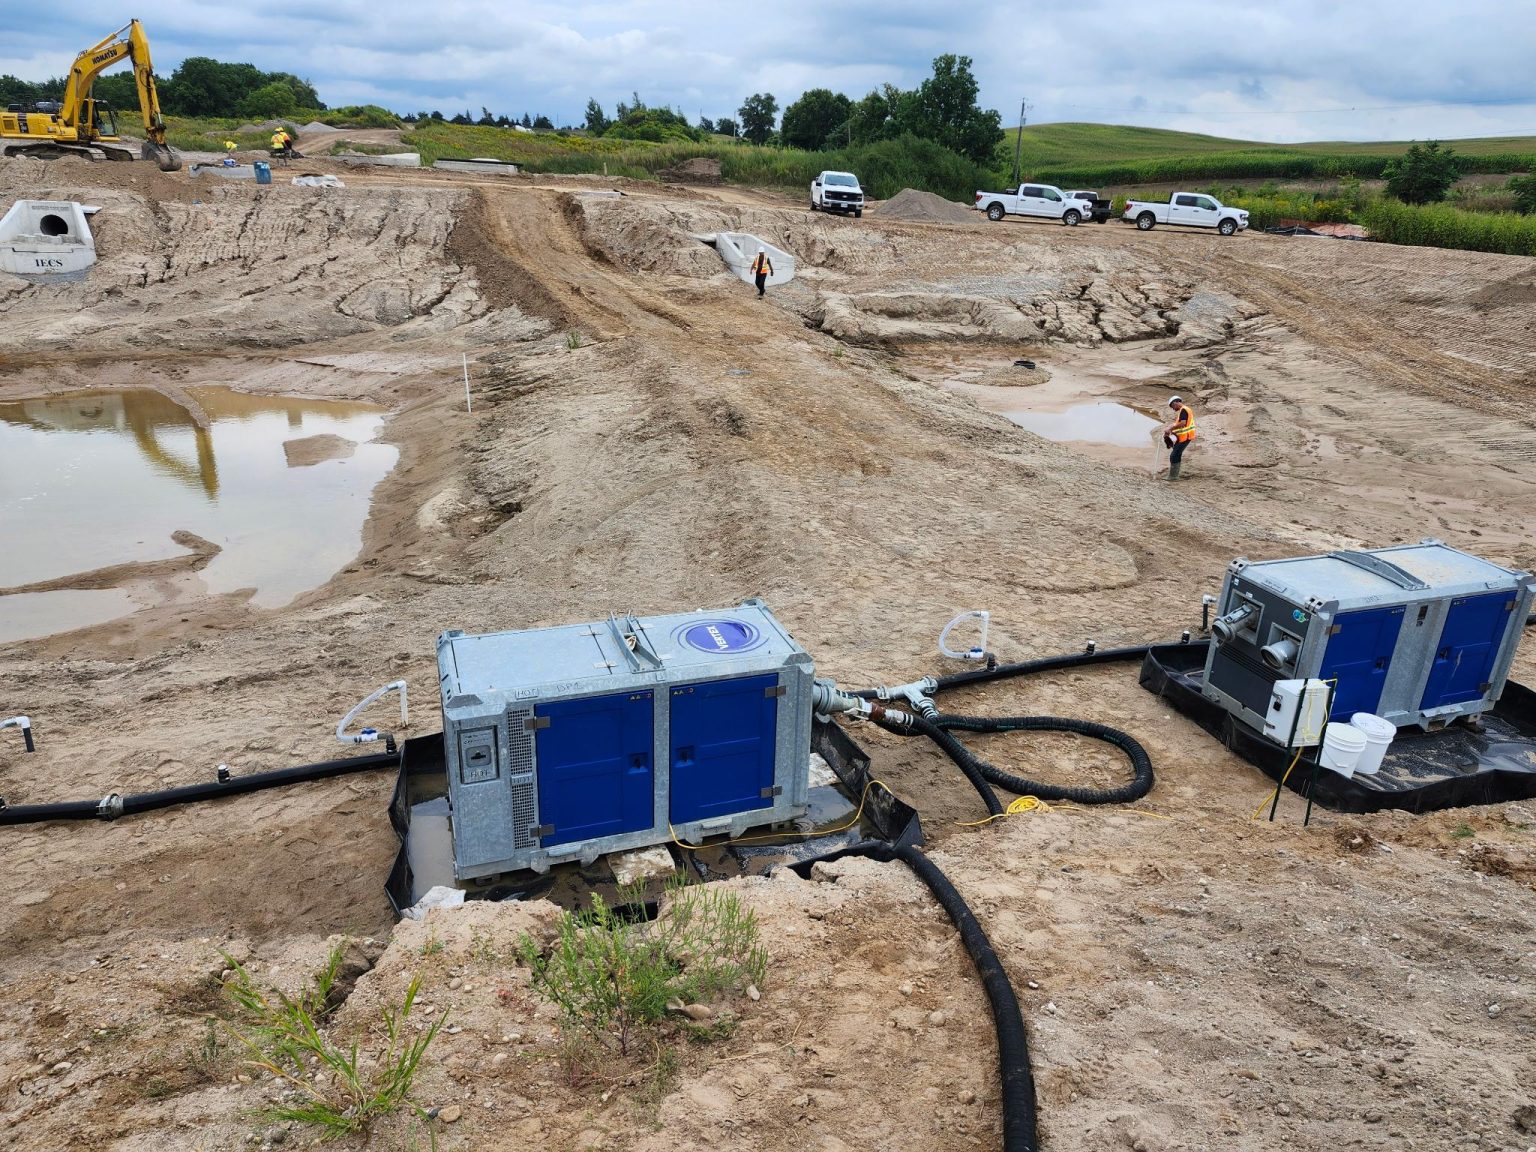
Figure 1: Benched Vacuum Wellpoint Dewatering System Using a Piston Wellpoint Pump for a Lagoon Excavation
Introduction
Designing effective dewatering systems is crucial for construction projects, as estimations, assumptions and other inaccuracies can lead to significant inefficiencies and result in increased costs. As part of the initial design process, construction dewatering assessments are completed to estimate dewatering flow rates (Q) and volumes required to complete the proposed subsurface construction projects. There are a variety of methods used to estimate required Q based on various equations, all of which rely heavily on accurate estimates of hydraulic conductivity (K). This makes the accurate estimation of K extremely important, if not the most important variable, for overall dewatering assessments and dewatering system design!
Limitations of Current Methods
Traditional methods for estimating hydraulic conductivity, such as grain size analysis, single well response testing, and pumping tests, often rely on limited data from a small number of monitoring wells. Current industry methods typically involve data collection from less than 10 wells, which may not adequately represent the heterogeneity of subsurface geologies. Sometimes these wells are screened across relatively large, discrete intervals in the sub-surface (i.e., 3.0 meters (m) or longer well screens) and can even straddle highly variable stratigraphic units or multiple water-bearing units. Given that K varies by orders of magnitude, this can result in wildly inaccurate estimates of the representative or average K value for a site. Errors in data collection and processing can further exacerbate the inaccuracies in estimating K and the resulting dewatering flow rate (Q).
Taken together these inaccuracies can result in:
- Incorrect selection of dewatering approaches,

Figure 2: Dewatering Methods as a Function of Hydraulic Conductivity (K) and Required Drawdown Depth
2. Over- or under-design of dewatering systems and their discharge/treatment capacity,
3. Delays due to permitting or redesign, and/or

Figure 3: Summary of Regulatory Permitting Requirements for Dewatering Projects in Ontario
4. Avoidable extra costs.
The Hydraulic Profiling Tool (HPT)
The Hydraulic Profiling Tool (HPT) is an underutilized tool that can greatly enhance hydrogeological investigations and improve the design and implementation of dewatering programs. The HPT is a direct-push tool that collects real-time soil permeability and electrical conductivity (EC) data at a high-resolution scale (e.g., every centimeter). When used in support of hydrogeological assessments that are being relied upon for dewatering system design, it can more accurately and abundantly collect relevant site data.
")
Figure 4: Schematic of the Hydraulic Profiling Tool (HPT)
Advantages of HPT
- High-Resolution Data: Unlike traditional slug tests that provide a single K-value over a 3.0 m (10 foot (ft)) screen, the HPT can yield 305 discrete, interpreted k-value data points over the same interval.
- Real-Time Data Collection: The HPT allows for adaptive field programs, enabling immediate investigation of unexpected subsurface observations, such as highly conductive seams, without the need for multiple drilling rounds.
")
Figure 5: Example of HPT Log with Corresponding Dissipation Test Log (Resembling a Falling Head Test)
As a demonstration of the value of incorporating the HPT into a site hydrogeological investigation the following real-world case study is presented.
Case Study: Future Development Project
This project involves the development of two multi-story high-rises and a shared underground parking facility. The proposed underground parking extends down to approximately 10 m below ground surface (bgs) or 33 ft bgs. The site’s geology consisted of fill and sand underlain by an undulating silt/silt till layer.
An initial dewatering assessment was completed by the consultant, which included slug testing in three (3) out of five (5) monitoring wells. The estimated hydraulic conductivity (K) was approximately 6.43 x 10⁻⁵ m/s, and the estimated dewatering flow rate (Q) was approximately 6,540,000 liters per day (Lpd) (i.e., 1,200 US gallons per minute (US gpm)). Given these significant volumes, the client requested supplemental details on subsurface permeability and geology to support permitting, dewatering system design, and excavation shoring design.

Figure 6: Monitoring Wells Used by Consultant for Slug-Testing
In response, VEI Contracting proposed a two-day HPT program to confirm subsurface geology and K values adjacent to existing monitoring wells. The program aimed to collect supplemental data within areas outside the initial scope of work. The HPT investigation included the advancement of five (5) HPT points adjacent to existing wells and seven (7) HPT points in other locations of interest throughout the site.

Figure 7: Enhanced Hydrogeologic Testing Program with HPT Testing Locations Added
During the data review, K values were estimated using slug testing and HPT dissipation testing results, which closely resemble falling head tests. The results were then compared against real-time HPT K estimates determined based on in-situ data points. Overall, the results showed good agreement between K estimated using the HPT dissipation approach and K estimated directly by the HPT. Comparison of these results against the initial slug test data indicated that HPT K values either matched or exceeded those determined by slug testing, suggesting that slug testing may have underestimated hydraulic conductivity across the vertical profile.

Figure 8: Comparison of HPT Log Against Corresponding Well Log with Estimated K Values
These findings may be significant, as sensitivity analysis of K versus estimated Q showed a potential increase of Q by approximately 2,000,000 Lpd (367 US gpm), or 30%, after increasing K by less than half an order of magnitude.
 Values vs Dewatering Rates (Q)")
Figure 9: Sensitivity Analysis of Hydraulic Conductivity (K) Values vs Dewatering Rates (Q)
Furthermore, the 3D modeling of HPT results revealed a highly conductive sand layer present across the eastern half of the site, with a thickness of 4 to 6 m (13 to 20 ft) between elevations of 318 m above sea level (m amsl) and 314 m amsl. The proposed development’s underground facilities were set to extend down to 315 m amsl, indicating extensive dewatering requirements. Additionally, a lower conductivity silt/clay unit was found to be present across the western portion of the site, requiring less significant dewatering efforts in that area. The majority of the site featured a lower conductivity silt/clay/till layer at approximately 313 m amsl, allowing for seepage control through a cut-off wall (e.g., shoring).
Major design revisions for proposed underground parking structures are currently underway as a result of obtaining this more accurate hydrogeologic data for the site. Specifically, the trade-offs of increased dewatering, water treatment, shoring and excavation costs vs the benefits of an additional level of underground parking for the development. Had the enhanced assessment not been completed ahead of construction the client would likely have been faced with increased construction costs and/or project delays. Now informed decisions can be made ahead of time.

Figure 10: Graphical 3D Rendering of K Values Resulting from the HPT Program
Conclusion
Incorporating modern tools like the HPT into dewatering system design can significantly improve accuracy and efficiency. By leveraging high-resolution site data and real-time adaptive field programs, construction projects can avoid the pitfalls of traditional methods and achieve better outcomes in terms of cost, time, and resource management.
This modern approach to dewatering system design highlights the importance of accurate data collection and the benefits of using advanced tools like the HPT. By addressing the limitations of traditional methods, we can ensure more effective and efficient dewatering solutions for construction projects.
Key Take-Aways:
- Thorough Understanding of Subsurface Geology: Accurate dewatering system design requires a detailed understanding of subsurface geology and hydraulic conductivity (K).
- Limitations of Low-Resolution Methods: Traditional methods do not capture soil heterogeneity and variability in K values, leading to potential over- or underestimation of dewatering volumes.
- Impact of Inaccuracies: Errors in K estimation can lead to incorrect dewatering approaches, system over/under-design, project delays, and increased costs.
- Benefits of HRSC and HPT: Utilizing HRSC and HPT can supplement dewatering assessments and optimize dewatering/shoring designs, leading to more efficient and cost-effective projects.
For more information on how this novel approach can be used to support dewatering system design projects please visit www.vei.ca or contact Farouk Abu-Hijleh at (519) 729-7772 and farouka@vei.ca or Patrick O’Neill at (519) 500-7362 and patricko@vei.ca.